How to Read Your First Report
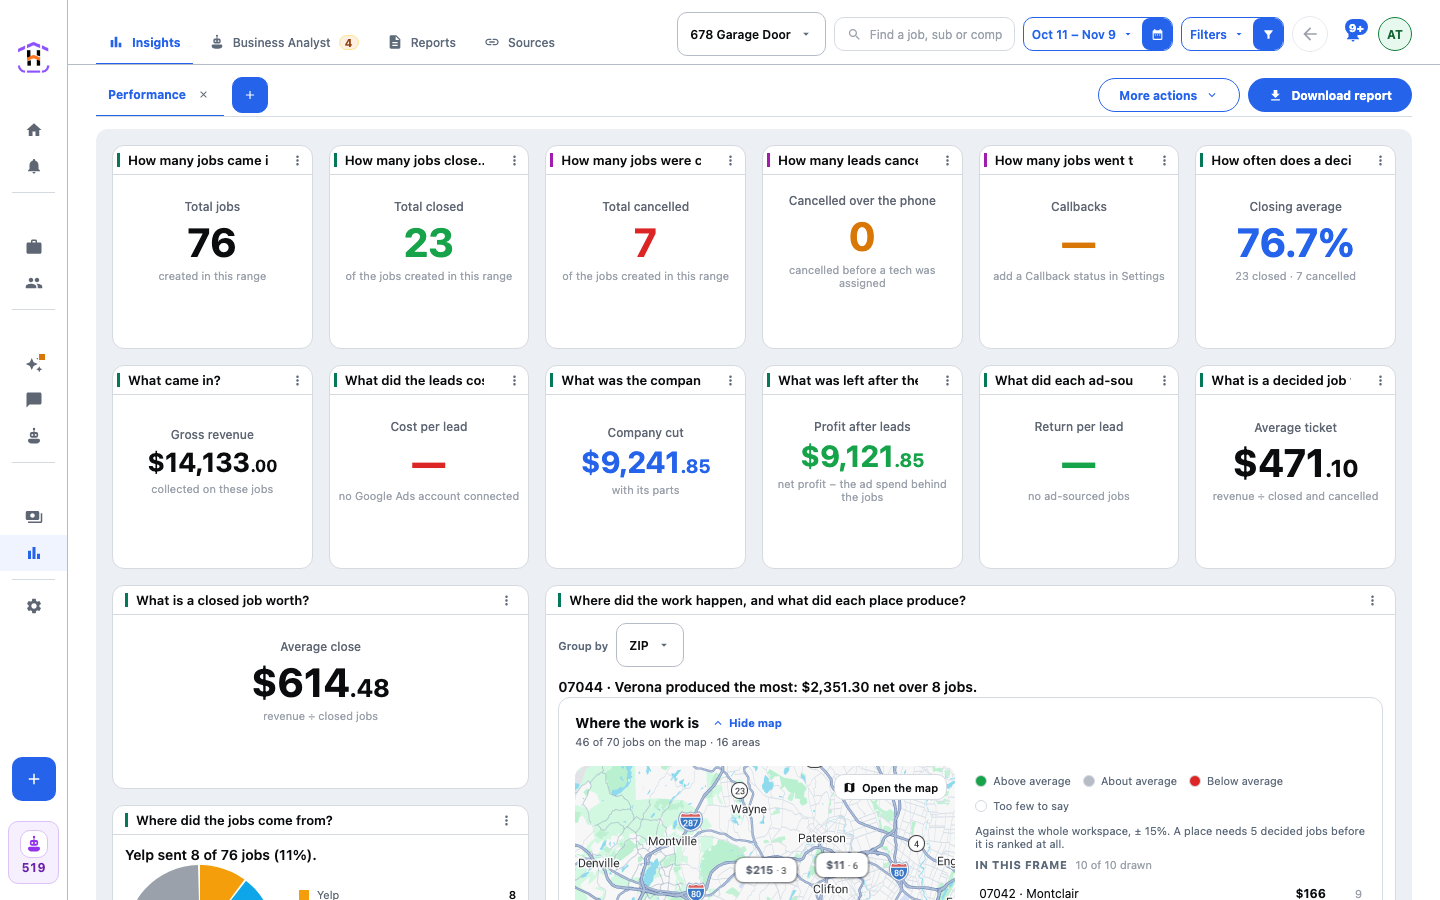
To read a marketing report, open Statistics, read the jobs row, then the money row. Redo the Cost per lead sum from the note under it, and check what was left after the ads.
The result: you can read your Statistics board and say what your ads cost per job and what was left. Time: ten minutes. Every dollar amount in this page is an example.
What You Need First
- Some jobs in HeadHoncho. A month of them is best, so the figures have something to add up.
- For the ad numbers, a connected ad account. See How to Connect Google Ads. Without one, the money row still works, and the ad figures show a dash.
How to Read a Marketing Report
- Open Statistics and set the dates. Pick last month. The board opens on Performance.
- Read the first row. Total jobs, Total closed, Total cancelled, Cancelled over the phone, Callbacks and Closing average. Example: 40 jobs, 28 closed, 6 cancelled. Closing average is closed divided by closed plus cancelled: 28 ÷ 34 = 82%. Open jobs are in neither side.
- Read Gross revenue. It is money collected on those jobs. Example: $21,000.
- Read Cost per lead and redo its sum. The note under it shows both numbers. Example: $1,800 Google Ads spend ÷ 12 Google Ads jobs = $150. Check it on a calculator. If the sum does not work, the screen is wrong, and you should tell us.
- Read Profit after leads. It is net profit less the ad spend behind the jobs. A negative number means the ads cost more than the work returned in this range.
- Read Return per lead. What one job from an ad is worth once its ads are paid for. Example: $620 of net profit per job, minus $150 of ad cost, gives $470.
- Press the source chart. It opens as a page: a longer chart, the table behind it, the definition of the number and the rows.
How You Know It Worked
You can say three things out loud: how many jobs the month made, what one cost you in ads, and what was left after the sub. If you can, you read it right.
If It Fails
- Cost per lead shows a dash. No Google Ads account is connected, or no job has Google Ads as its source. The note says which.
- A chart is missing a tech. A tech with no decided jobs has no closing rate and is left off, not shown at zero.
- Money looks lower than the jobs suggest. Money follows the day it was collected, jobs follow the day they were booked. See the two windows on the docs page.
- The number surprises you. Open the widget and read the rows behind it. The rows are the claim.
Next
Read the Statistics docs for every figure. For the reason spend ÷ jobs beats a click price, read Cost Per Booked Job, Explained.