
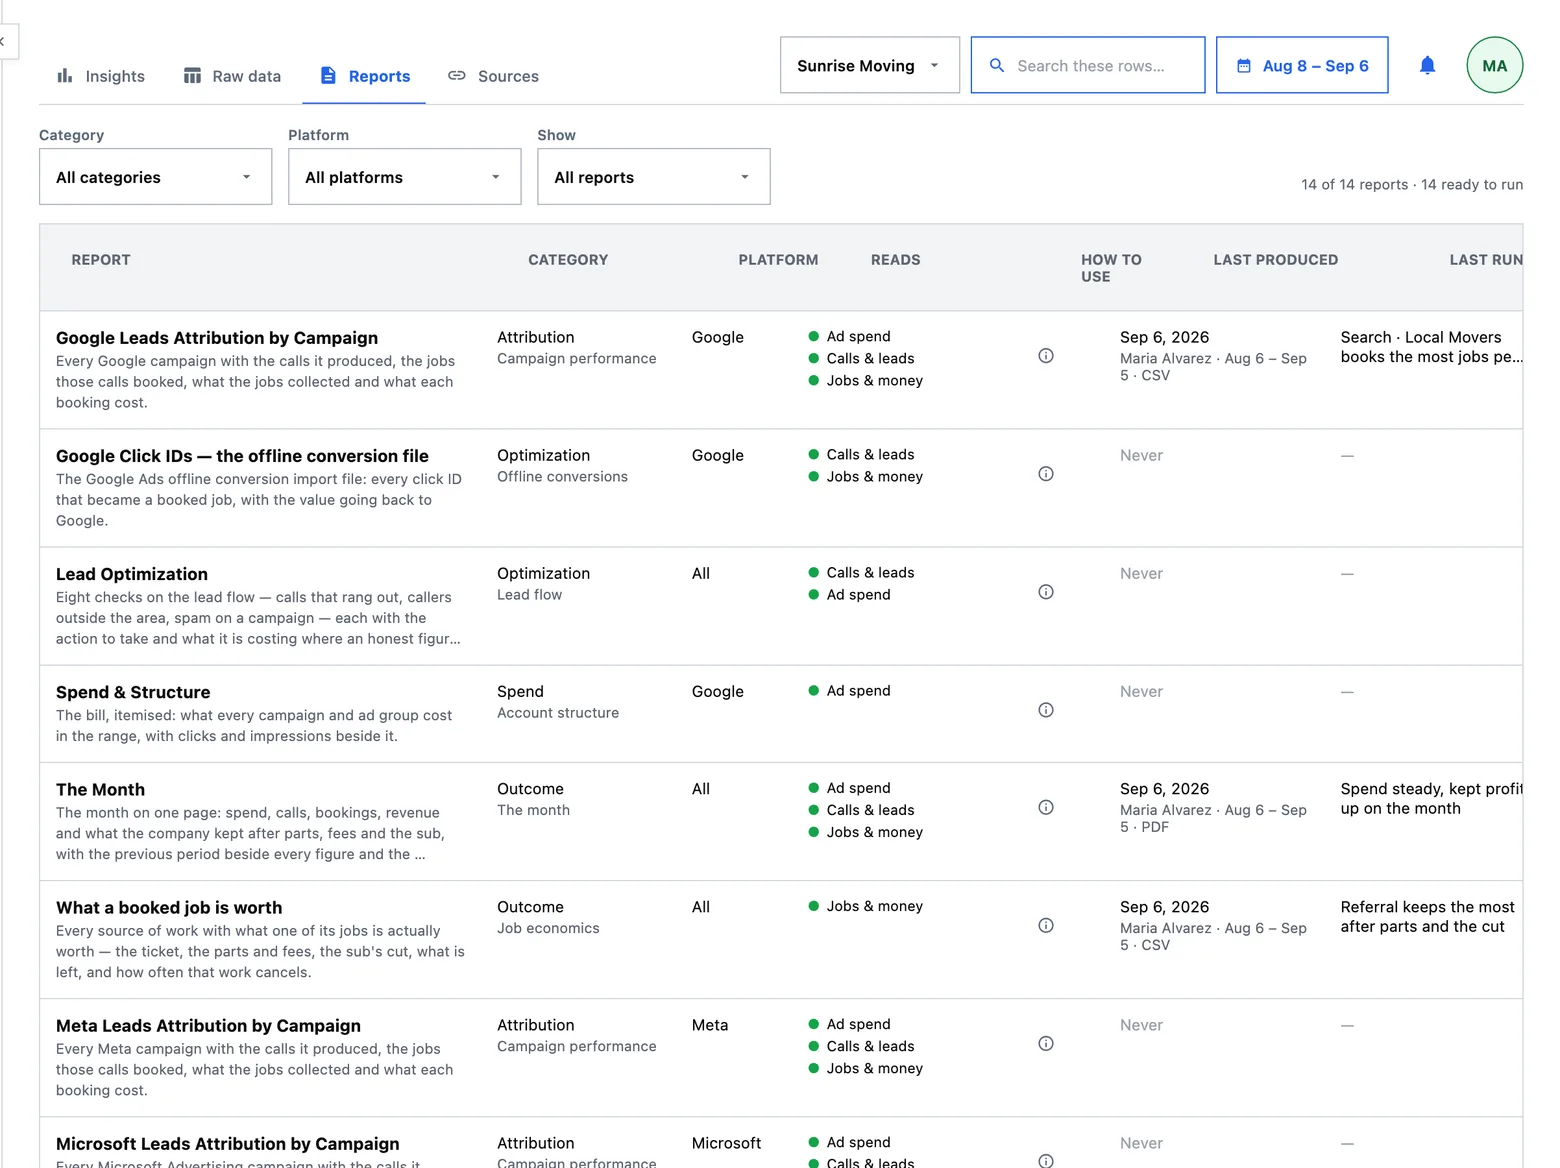
Reports is a catalogue rather than a folder of exports. Every row says what the report shows, which category and platform it belongs to, what it needs in order to run, and — in the reader's own words — what to go and do with it once it is on screen.
What a catalogue row carries
Marketing reports for home services fail in one of two ways: nobody can tell which report answers their question, or somebody reads a number the report never claimed. Each row carries the fields that head off both.
| Field | What it is for |
|---|---|
| The question | What you ask. The catalogue is scanned by question, not by filename |
| The description | What you get. Different from the question on purpose |
| Category, subcategory, platform | Three facets, each filterable, so a catalogue that grows stays scannable |
| What it reads | Which of the three layers it needs. This is what greys a row out |
| The caveat | What the numbers cannot claim |
| How to use it | What to go and do with them. The one sentence a caveat is not |
| Whether the file carries personal data | Said on the control before it is pressed. An export that hands over caller phone numbers without saying so is a surprise, not a feature |
The reports
Fourteen, in five categories. Three of them share one runner across three platforms, which is why campaign attribution reads the same whichever network you are asking about.
| Category | Report | The question it answers |
|---|---|---|
| Attribution | Google Leads Attribution by Campaign | Which campaigns produced booked jobs, and at what cost |
| Attribution | Meta Leads Attribution by Campaign | The same question, on Meta |
| Attribution | Microsoft Leads Attribution by Campaign | The same question, on Microsoft |
| Attribution | The Lead Ledger | Where every call went: matched, unmatched, ambiguous, or never carrying an identifier |
| Attribution | Where the money is | Which places earn, and which just cost clicks |
| Optimization | Google Click IDs | Which booked jobs are in the upload file, and for the rest, why not |
| Optimization | Meta Conversions | The booked jobs matched on Meta |
| Optimization | Lead Optimization | Eight checks over the call thread, each with what it cost and the one action that would change it |
| Optimization | Call Handling | When calls come in, and when they go unanswered |
| Optimization | Headroom & Pacing | Whether the budget is being spent evenly, or front-loaded |
| Spend | Spend & Structure | Where the money went inside the account |
| Outcome | The Month | The thirteen numbers a client asks for in the meeting, with last month beside each |
| Outcome | What a booked job is worth | How one booked dollar splits, by source |
| Portfolio | Every client on one page | The agency's own book: what each client kept per ad dollar, and who moved |
Two things to notice. Outcome is the category no ad platform can fill — what the money became after the crew was paid — and it is the reason this catalogue exists at all. Portfolio is the only category whose reader is the agency rather than the agency's client, which is why it is the one report that deliberately does not narrow to a single company: a roll-up of one client answers a different question.
Running one
A report opens as a page of its own with a date range on it, and some carry a parameter or two. The one worth understanding is the value basis on the conversion reports: what a booked job is worth can be read at three rungs — the revenue, the gross profit after parts and fees, or the net after the subcontractor's cut. The column is named for the rung in force, and the file downloads on the same rung the screen showed.
Where a report draws a chart, it is drawn with the same marks the dashboard uses, so a chart on a forwarded PDF is the same chart as the one on the board. Nothing is redrawn for print.
Viewing and downloading are different acts
Opening a report shows you numbers. Downloading it records that it was produced — a report run, with the report, the format, the window, the headline figure and the coverage it was produced at.
The distinction is deliberate and it is worth knowing which side you are on. Looking at a number is a private act; sending one to a client is not, and the thing worth having a record of is the document that left. The run is recorded after the file renders, never before, so a “last produced” can never name a file nobody received.
The catalogue prints the last production of each report, which answers the question most people open the panel with: when did we last send this?
The upload file
One report is not really a document — it is the file you upload back into the ad platform, valuing each booked job at what it actually produced. It is listed like every other report, and it carries the three numbers without which it is misread: how many calls carried no identifier at all and why, how many matched jobs are held back for having collected nothing, and how many sit on a network the file does not export.
Two properties make it safe to use:
- Re-uploading is safe. The platform overwrites a click identifier rather than adding to it, so a job whose collected value rose since the last upload simply corrects itself.
- One company per file. The file has a destination — it is uploaded into one ad account — and the filename says whose it is.
The screen pages at a hundred rows; the file does not page at all, and everything held back is counted in the file itself, so a spreadsheet cannot imply a completeness the screen never claimed.
Why a report is greyed out
A report names what it reads. A report that needs spend cannot run without an ad platform connected; one that needs calls cannot run without a call source. Rather than running and printing zeros, the row says which connection it is waiting on and links to Sources.
For a handful of reports, being connected is enough and rows are not required — those report an honest empty answer instead of a demand. That is a promise about the individual report rather than a property of the catalogue, so it is declared per report rather than assumed.
When a number in a report is the one you doubt, the foot of every report leads to Raw data, which is the rows it was drawn from.